Chart
Dotted Trend
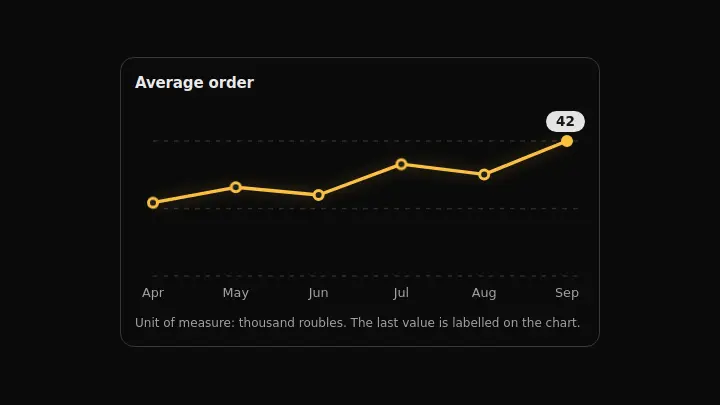
A line with every point marked and the last value called out on the chart itself: «where the readings are» and «where we are now» in one picture.
React + Tailwind, shadcn-compatible: press “Copy for AI” and your Cursor or Claude Code agent installs it with the shadcn CLI.
What you can change
- the points array: a label and a value per reading
- title — the chart heading
- unit — the unit named in the caption under the chart
A link for your AI agent: preview, code and instructions.
Preview
Use it with AI
- 1. Copy the link.
- 2. Write to your agent in your own words and drop the link into the sentence.
- 3. The agent opens the link and installs the component from the registry.
put this on the home page as the hero:
https://vibeui.club/c/chart-011?lang=en&theme=dark
Not sure where to paste it? Step-by-step guide
Show the full instructions
What the link says, spelled out. Use it when your agent cannot open links — paste this text instead.
Loading…
How to use
<Chart011
  title="Average order"
  unit="thousand roubles"
  points={[{ label: "Apr", value: 18 }, { label: "May", value: 24 }]}
/>
A sample call. The agent installs the component itself from the registry via the “Copy for AI” link.
Settings
- Heading
title· default: Average order- Unit
unit· default: thousand roubles- Accent
accent· default: theme colour- Background
background· default: theme colour- Entrance animation
animate· default: on
More in Chart
FAQ
- How do I add Dotted Trend with Cursor or Claude Code?
- Press “Copy for AI” on this page and paste it into your agent's chat. The instruction contains the shadcn CLI install command, the dependencies and what to keep, so the agent installs this exact component instead of recreating a lookalike.
- What does Dotted Trend depend on?
- No npm packages beyond React and Tailwind CSS.
- What can I change in Dotted Trend?
- Adapt: the points array: a label and a value per reading; title — the chart heading; unit — the unit named in the caption under the chart. Keep as installed: the local --vibeui-chart-011-* palette — do not swap it for your theme tokens (bg-card, --chart-1 and the like); the lowered floor: a line resting on the axis reads as zero even when the data has no zero; the callout on the last value: a trend without a number never says how much.
- Is Dotted Trend free?
- Yes. The preview is open without an account; with a free account you can copy up to 20 components a month.
For developers
npx shadcn@latest add https://vibeui.club/r/pro/chart-011.jsonThis command needs a signed link: sign in and open “Component source” below — it issues a working link valid for 30 minutes. All install options
Technical notes
The component is self-contained: one file, zero dependencies, its own palette in the local --vibeui-chart-011-* variables. Server component: no hooks. The line path is computed from the points array in a 300×136 coordinate system, and the floor is lowered by a quarter of the spread below the minimum so that the line does not rest on the axis. The last point is filled solid and carries a dark callout badge above it: its width is estimated from the number of characters, and its position is clipped by the viewBox edge. The data is mirrored in a visually hidden table. Motion: the line reveals left to right, dots pop in one after another, the last-value callout fades in; hover highlights a dot; reduced motion shows everything at once; animate=false turns it off.
Tags
- chart
- line
- trend
- svg
- animated
Component source
The same file your agent installs. Here in case you would rather copy it by hand.
Loading…