Chart
Metric Table
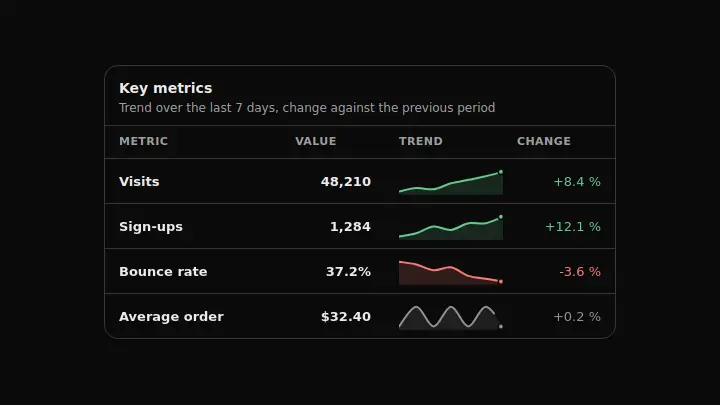
A metrics table where the trend lives inside the row: the data is already text, so the table itself is the text alternative to the curves.
React + Tailwind, shadcn-compatible: press “Copy for AI” and your Cursor or Claude Code agent installs it with the shadcn CLI.
What you can change
- the rows array: label, value, delta and the values series behind the curve
- caption — the table heading
- period — the period note under the heading
A link for your AI agent: preview, code and instructions.
Preview
Use it with AI
- 1. Copy the link.
- 2. Write to your agent in your own words and drop the link into the sentence.
- 3. The agent opens the link and installs the component from the registry.
put this on the home page as the hero:
https://vibeui.club/c/sparkline-002?lang=en&theme=dark
Not sure where to paste it? Step-by-step guide
Show the full instructions
What the link says, spelled out. Use it when your agent cannot open links — paste this text instead.
Loading…
How to use
<Sparkline002
  caption="Key metrics"
  period="over the last 7 days"
  rows={[{ label: "Visits", value: "48,210", delta: 8.4, values: [31, 34, 41, 48] }]}
/>
A sample call. The agent installs the component itself from the registry via the “Copy for AI” link.
Settings
- Table heading
caption· default: Key metrics- Period
period· default: over the last 7 days- Accent
accent· default: theme colour- Background
background· default: theme colour
More in Chart
FAQ
- How do I add Metric Table with Cursor or Claude Code?
- Press “Copy for AI” on this page and paste it into your agent's chat. The instruction contains the shadcn CLI install command, the dependencies and what to keep, so the agent installs this exact component instead of recreating a lookalike.
- What does Metric Table depend on?
- No npm packages beyond React and Tailwind CSS.
- What can I change in Metric Table?
- Adapt: the rows array: label, value, delta and the values series behind the curve; caption — the table heading; period — the period note under the heading. Keep as installed: the local --vibeui-sparkline-002-* palette — do not swap it for your theme tokens (text-green-500, --chart-1 and the like); the table as the component root: the data must be available as text, and here it comes for free; aria-hidden on the curves: the row has already been read, the picture would only add noise.
- Is Metric Table free?
- Yes. The preview is open without an account; with a free account you can copy up to 20 components a month.
For developers
npx shadcn@latest add https://vibeui.club/r/pro/sparkline-002.jsonThis command needs a signed link: sign in and open “Component source” below — it issues a working link valid for 30 minutes. All install options
Technical notes
The component is self-contained: one file, no dependencies, its own palette in the local --vibeui-sparkline-002-* variables. Server-side: there are no hooks. The root is a real table, so the charts need no separate text alternative: the curves are marked aria-hidden. The sparkline path is computed from the values array in a 100×24 coordinate system with preserveAspectRatio="none", and the stroke width is held by vector-effect: non-scaling-stroke. The direction is derived from the sign of delta with a half-percent threshold and lands in data-trend on the row, which drives both the curve colour and the colour of the change.
Tags
- sparkline
- table
- metrics
- trend
Component source
The same file your agent installs. Here in case you would rather copy it by hand.
Loading…